
One of the key benefits of a Cloud Infrastructure is elasticity and scalability. These capabilities stand in contrast to an on-premise datacenter that permanently hosts all resources to handle the maximum calculated load at any time. Instead of idling resources in a datacenter, the Cloud offers the ability to continuously scale in and out resources to meet demand. If resources are properly scaled on a Cloud infrastructure then you will only pay for what you use (CapEx vs OpEx).
So, in order to achieve a cost optimum on the cloud, you will have to think about (auto)scaling. And although autoscaling seems a trivial thing at first, as soon as you dive into the topic you will discover quite some quirks and pitfalls.
In this series, I’ll go over different autoscaling pitfalls and offer a proper solution to those. But first, let’s start with some overall guidelines around scaling.
1. What is the actual bottleneck?
Finding the bottleneck in your setup is probably one of the most important things to do. Imagine a setup where a database is the bottleneck. If you would start to scale out a fleet of backend containers on top of a database which is close to maximum capacity then your only achievement will be to drown the database even faster. It’s key to scale the bottleneck first, components in front or behind it could follow later.
2. To measure is to know
Another thing you should not lose sight of before you start with autoscaling are metrics. The setup of scaling is done around algorithms and the crossing of pre-defined thresholds. This implies that you know the ins and outs from the parts you want to scale. In other words, harvest the proper metrics of all pieces involved in scaling. Ask yourself questions like:
- What is the amount of traffic received within a certain time period?
- What is the maximum capacity a single entity (Container, Instance, Lambda,…) can handle?
- Which entity resource encounters the most pressure? (CPU, RAM, I/O, …)
After answering these questions you will most likely end up with metrics about bandwidth, latency, CPU, RAM, Disk I/O, Request per Second (rps), Connection Count, Busy Threads, …
Harvesting these metrics is again about finding a bottleneck, but this time on a much deeper level. Only after obtaining a clear insight into an infrastructure, can you start to build the logic to properly scale in and out!
Scenario 1: CPU starvation throws a spanner in the works
One of the most common pitfalls with autoscaling is premature starvation due to resource exhaustion (either CPU or Memory).
Some theory
For a better understanding of the actual problem let’s start with an example of a scaling algorithm. Most of the time, a scaling algorithm has a baseline, a maximum and some boundaries in which it can properly scale. This means that some scenarios can still cross the pre-defined boundaries in which you can scale fast enough to cope with increased load. Flash traffic is probably the most well-known example in which it is often too hard to scale fast enough in order to handle extra load.
Below is a visualisation of an arbitrary scaling algorithm with a baseline of 400 rps (request per second) and a maximum capacity of 2000 rps. A scale-out event is limited to adding 400 rps every 5 mins. These numbers are visualized by the green line and are the boundaries in which the algorithm can properly scale and keep up with traffic.
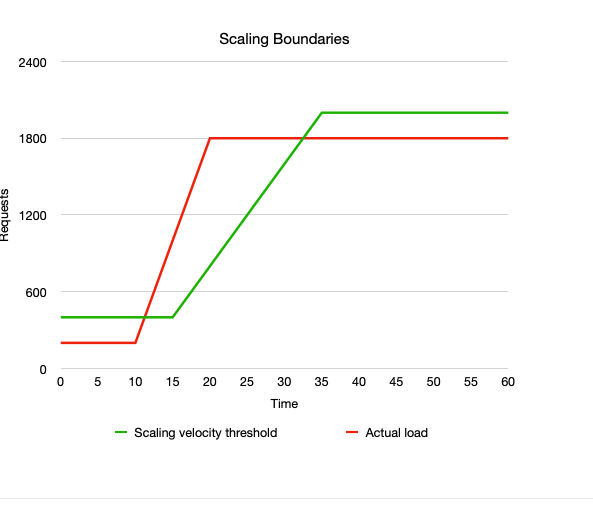
The red line in the graph above is an example of traffic that arrives too fast for this scaling algorithm to keep up. In a worst-case scenario, the red line will almost be perpendicular to the x-axis. In such a case time-based scaling is often the only solution to keep up with traffic (with the assumption that the load is predictable in time).
How to handle excessive traffic?
What you should keep in mind is that it’s crucial to cover also the scenario in which load is arriving faster than expected (the red line in the example above). In case this excessive load is not properly handled, it can cause a cascade of failures (most likely due to resource exhaustion).
To give you a better idea, once a resource reaches maximum capacity most likely this happens:
- Its health check will start failing and it will be flagged as unhealthy
- Your infrastructure will destroy the unhealthy resource (Container, Instance, …)
- You end up with fewer resources
- Fewer resources mean more pressure on the remaining ones
The effect? Probably any replacement resource or extra resources triggered by a scale-out will suffer from premature starvation due to resource exhaustion. These resources will drown before they will have the chance to come up properly. They are simply bombarded with such a load that they will never reach a healthy state. One thing that could help are “slow starts” but that’s a topic for the next episode. Often your only life jacket in this scenario is to throw in an army of resources in order to divide the load into portions small enough so that can be handled by a single entity (Instance, Container, …).
A Concrete example
Let me illustrate the above with a real example and offer a solution.
Setup
- A hello world Spring Boot application packed in a Docker container exposing a REST backend
- An ECS service running the Docker container as two Fargate Tasks with 0.5 vCPU each
- Artillery to create some heavy load
The code is available at https://github.com/element7-io/ecs-load-test
Run 1: No Handbrake
In the first run, I unleashed artillery.io against the two Fargate containers hosting the simple spring boot backend.
This is the result of Artillery:
All virtual users finished
Summary report @ 10:36:38(+0000) 2021-01-07
  Requests completed:  300000
  Mean response/sec: 439.96
  Response time (msec):
    min: 4.2
    max: 55956.3
    median: 3162.6
  Codes:
    200: 101825
    500: 34167
    502: 32901
    503: 109021
    504: 22086
  Errors:
    ECONNRESET: 6
This is a CloudWatch graph taken while the test was running:
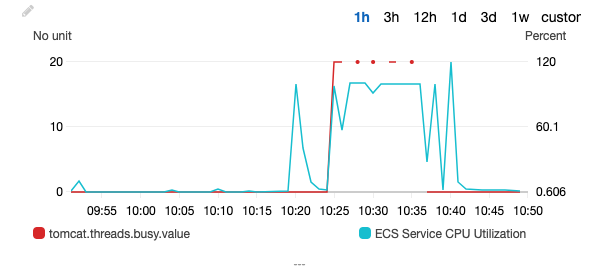
The key takeaways are:
- There’s quite a variety of error response codes: 500’s, 502’s, 503’s, 504’s and even connection resets. Both status 502 and 504 indicate the backend became unresponsive.
- The median response time was about 3 seconds!
- The Cloudwatch graph clearly indicates an unresponsive backend. The service chokes itself so much that it even was unable to report its metrics to CloudWatch (hence the dots instead of a line).
Overloading a backend designed this way quickly causes a health check to fail resulting in shutdowns and replacements. In case a scale-out trigger is also fired at the same time the results will become quite unpredictable. Will the new resources ever come up? At least some will prematurely die from resource starvation for sure. Worst-case none will ever come up until the load goes back to normal. Best-case you will survive the storm but handling the extra load will take more time than necessary due to loss of prematurely died resources.
In the end, this feels like filling a bucket full of holes.
Run 2: Fail Fast
Failing fast has almost become a buzzword, nevertheless, in quite some cases it’s a good pattern to apply. One of my favourite articles regarding this topic is the one from Netflix: Tuning Tomcat For A High Throughput, Fail Fast System. The key takeaway from that article is this paragraph:
Track the number of active concurrent requests in memory and use it for fast failing. If the number of concurrent requests is near the estimated active threads (8 in our example) then return an HTTP status code of 503. This will prevent too many worker threads becoming busy because once the peak throughput is hit, any extra threads which become active will be doing a very lightweight job of returning 503 and then be available for further processing.
Rephrased being environment and language agnostic it says: Whenever your backend almost reaches maximum capacity it’s often a good idea to bypass the business logic of your backend and return a 503 instead right away.
In code this could look like this:
@RequestMapping("/hello")
@ResponseBody
public ResponseEntity hello() {
  try {
      Gauge busyThreads = repo.get("tomcat.threads.busy").gauge();
      double busyThreadsCount = busyThreads.value();

      if (busyThreads.value() > 18){
           return new ResponseEntity(HttpStatus.SERVICE_UNAVAILABLE);
      } else {
          // Actual Business Logic
          Thread.sleep(50); // Mocking load
          return new ResponseEntity<String>("Hello World!", HttpStatus.OK);
      }
  } catch (InterruptedException e) {
      e.printStackTrace();
      return new ResponseEntity(HttpStatus.INTERNAL_SERVER_ERROR);
  }
}
Remark 1: I obtained the threshold value of 18 for Tomcat’s busy threads by running several tests using different values. When you run a load test in this context, in most case as soon as get back 504’s you’ve probably stretched too far. In this particular case, it was presumably possible to stretch the threshold a tad more. However, since CPU steal time is such a nasty thing it’s better to stay on the low side and play it safe.
Remark 2: regarding 504’s, AWS recommends that you configure the idle timeout of your application to be larger than the idle timeout configured for the load balancer.
Remark 3: The “Fail Fast” check should always be the first thing to do, before any other code! All your endpoints except your health check should implement the fail fast pattern.
@RequestMapping("/health")
public String health() {
  try {
      Thread.sleep(50);
  } catch (InterruptedException e) {
      e.printStackTrace();
  }
  return "Ok";
}
The “Fail Fast” mechanism implemented in your endpoints will now prevent your resources from drowning. So while your endpoints return 503’s under heavy load in order to prevent resource exhaustion, the same mechanism also preserves enough room for your health check to stay healthy and return 200’s all the time.
For the second run, I unleached Artillery again against the slightly modified “Fail Fast” backend.
This is the result of Artillery:
All virtual users finished
Summary report @ 12:11:59(+0000) 2021-01-07
  Requests completed:  300000
  Mean response/sec: 469.62
  Response time (msec):
    min: 1.8
    max: 362.8
    median: 56.3
  Scenario counts:
    0: 269810 (89.937%)
    1: 30190 (10.063%)
  Codes:
    200: 249695
    503: 50305
This is a CloudWatch graph taken while the load test was running:
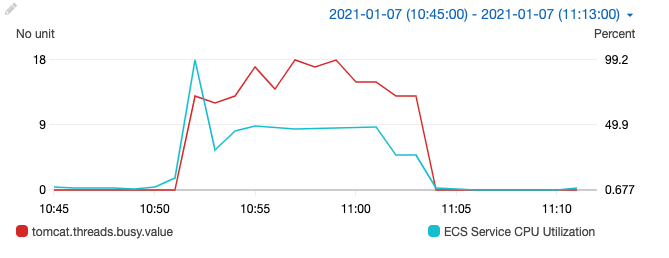
Compared to the first test:
- The responses are either good (200) or bad (503). This time there’s no intermediate state, like connection timeouts.
- The median response time is about 56 milliseconds (compared to 3 seconds in the first run)!
- The Cloudwatch graph clearly indicates that the backend was responsive all the time.
Conclusion: Fail fast and make room for error
The benefits of the “Fail Fast” strategy are obvious, it prevents resources exhaustion and prematurely starvation. The result is a more stable backend and more predictable behaviour.
But hey, isn’t returning 503 Errors a bad thing?
Short answer: no. If you follow a “Fail Fast” strategy like this it’s important to inform your consumers about this as well. Also, document this behaviour in your API. It should be clear to everyone that your backend could return a 503 under heavy load (extra tip: also make it part of your SLA). It could also be handy to describe patterns in your documentation to deal with 503 responses. Retries and exponential backoff are most likely good suggestion to implement client-side.
Anyway, your consumers should implement the ability to handle 503 status response in a way that it has minimal impact on end-user experience.
That’s it for now. Next week, Part 2: How to scale unpredictable traffic.